Topics
1. Global trends in DAC donors’ Official Development Assistance (ODA) Go to section
2. Achieving the 0.7% target Go to section
3. Individual donor trends Go to section
See also Trends in Allocation of Global ODA Go to this page
A narrative overview of Global Aid Trends can be found in Global Aid Trends, 2016, Financing Agenda 2030: Where are the Resources, by Brian Tomlinson, AidWatch Canada, in the Reality of Aid Network, 2016 Global Reality of Aid Report, October 2016. Data has been updated taking account the OECD Development Assistance Committee’s preliminary aid data for 2016, released April 11, 2017.
Analysis of global aid trends has been recently updated in Brian Tomlinson, September, 2018. Trends in the Reality of Aid, 2018: Growing diversions of ODA and diminished resources for the SDGs. A chapter for the Reality of Aid Global Report, 2018, Changing Faces of Aid (forthcoming). However, these updated trends have not yet been reflected in the data and narrative of the global aid trends pages.
Calculations on this page are by AidWatch Canada, based on statistics published by the OECD DAC.
1. Global trends in DAC donors Official Development Assistance (ODA)
ODA has great potential to be an essential resource, within a broader range of development finance, to catalyze investment in achieving the Sustainable Development Goals (SDGs). It has the potential to be exclusively focused on poverty reduction and “leaving no one behind” in the financing of Agenda 2030.
What do current trends in global ODA reveal about the potential of this resource to achieve these purposes?
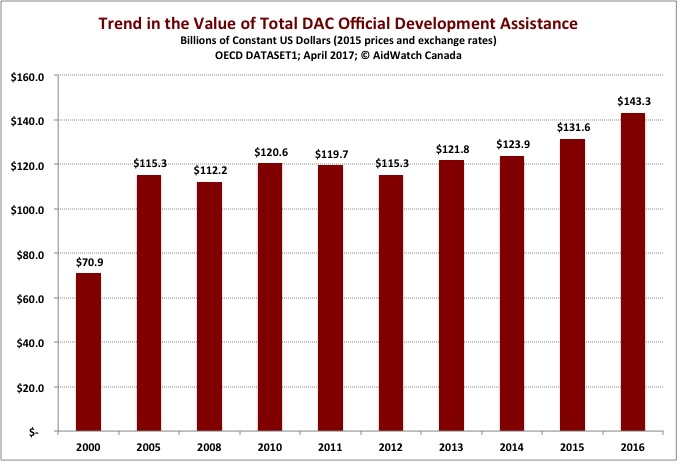
The value of ODA (in 2015 dollars) has increased constantly since 2010, with the value of ODA in 2016 reaching 19% more than it was in 2010. In April 2017, the OECD’s Development Assistance Committee (DAC) headlined a significant increase in the value of ODA for 2016, at US$142.6 billion, increasing 8.9% compared to 2015 (at 2015 prices, adjusting for inflation and exchange rate changes). It has grown each year, and is now 19% greater than its value in 2010.
But the DAC also noted continued significantly increased in-donor refugee costs for many European donors, as a result of the surge of asylum seekers in Europe in that year. These costs rose from US$12.1 billion in 2015 to US$15.4 billion in 2016, or by 28%. If these costs are excluded, ODA still rose by 7.1% in real terms, according to the DAC. See the value of real ODA below.
See Trend in the Value of Total DAC ODA, 2000 to 2016 (2015 US Dollars)
In 2016 five DAC donors — France, Germany, Japan, the UK and the US — contributed two-thirds (67%) of total ODA for that year. Just two donors, the United States and the United Kingdom, make up 39% of total ODA (discounting in-donor refugee costs). Policy changes in these countries can have a big impact on the overall future directions for DAC aid. German aid, however, has also grown significantly between 2015 and 2016, reaching US$18,452 million or 24% more than 2015.
ODA remains less than 50% of the UN designated target for ODA (0.7% of Gross National Income). At 0.7% ODA would have been $315 billion in 2016 and could play a truly catalytic role in reducing poverty and inequality in the achievement of the SDGs. Current DAC ODA in 2016 is only 45% of this target.
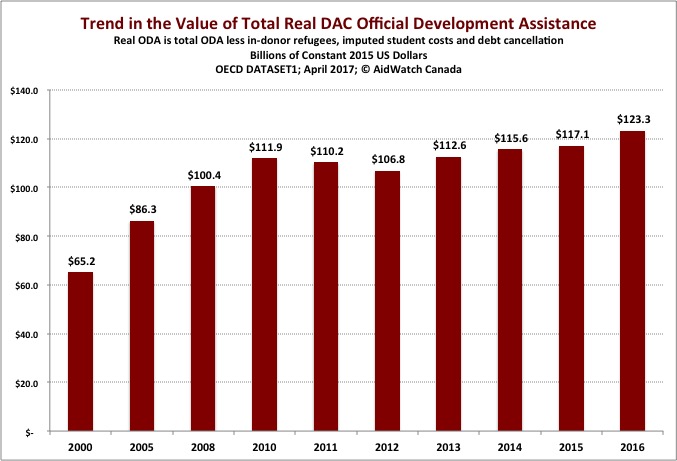
According to AidWatch Canada’s calculations, Real ODA in 2016 (in 2015 dollars) was 5.3% higher than 2015, and has grown by 10% since 2010. The DAC allow donors to include the costs of refugees living in their country for their first year, the imputed costs of donor education institutions for students from developing countries studying in their countries, and the full value of debt cancellation in the year that it is cancelled. These inclusions, while very welcome policies, distort the true value of ODA for developing countries. The calculation of “Real ODA” removes these three amounts from annual disbursements for DAC donors.
When Real ODA is calculated for 2016, the value of this aid drops by US$20 billion, from US$143.3 billion to US$123.3 billion, a significant reduction of 14%, largely due to the inflation of aid by in-donor refugee costs in several European donor countries.
At US$123.3 billion, in effect, the aid funds available to developing countries (in value terms) in 2016 has grown slowly since 2010. Real ODA has increased by 10% between 2010 and 2015, while the increase between 2005 and 2010 was 31%.
See Trends in the Value of Real Official Development Assistance (ODA), 2014 Dollars
Data calculated as of April 2017.
2. Achieving the 0.7% target
If all DAC donors honored the UN target to devote 0.7% of their Gross National Income (GNI) to ODA, ODA would have been US$315 billion in 2016, about 120% more than the level reached. If donors had kept to the commitments made in the 2005 Gleneagles G7 Summit to increase their aid, ODA would have been US$194 billion, more than 36% higher than the level achieved in 2015.
Achieving the 0.7% UN target would provide a very significant level of resources for developing countries, which could be targeted to people living in poverty or who are otherwise marginalized in their society.
Declining performance among the donors formally achieving the 0.7% target in 2016. Only 3 donors achieved this target when in-donor refugee costs are excluded. In 2013, the United Kingdom was the first G7 donor to achieve the 0.7% target, despite sharing the economic hardships of many of other G7 countries, such as Canada. In 2016, Germany also achieved the 0.7% target, but only because of very large in-donor refugee costs.
Only 6 traditional DAC donors have formally met this UN target in 2016 – the UK (0.70%), Denmark (0.75%), Luxembourg (1.00%), Norway (1.11%), Sweden (0.94%), and Germany (0.70%).
But when in-donor refugee costs are removed, the picture is very different. Only 3 DAC donors achieved the 0.7% target in 2016. The UK (0.68%), Denmark (0.62%) and Germany (0.52%) all fell below the 0.7% target, excluding in-donor refugee costs. The Netherlands, traditionally a 0.7% donor, fell back to 0.59% (net of in-dornor refugee costs), its lowest performance in decades. Luxembourg (1.00%) does not include refugee costs in its ODA. Norway dropped back to 0.91% and Sweden to 0.78%.
Data calculated as of April 2017.
3. Individual donor trends
Canadian aid declines in 2016 according to the DAC According to the DAC, in 2016 Canada provided US$3.96 billion in ODA, down from US$4.28 billion in 2015. Canada’s DAC performance ratio was 0.26% in 2016, down from 0.28% in 2015. [These aid statistics are reported by Canada on a calendar year basis and differ from total disbursements in Global Affairs Canada’s Statistical Report on International Assistance, which is based on Canada’s fiscal year – April to March].
Four donors with major increases in ODA offset decreasing ODA among 11 of 22 traditional donors Comparing individual donor ODA between 2015 and 2016, 11 of 22 traditional DAC donors had decreases in their ODA, net of in-donor refugee costs. Including in-donor refugee costs and taking account of inflation and exchange rates, only 8 of 22 donors experienced decreases in ODA.
However, four donor had major increases between 2015 and 2016 (net of in-donor refugee costs): Germany – US$3.5 billion; Japan – US$1.2 billion; Spain – US$2.7 billion; and the United States – US$2.1 billion. These donors more than off-set declines by other donors so that DAC donors as a whole posted a net increase in ODA. Taking the other 18 traditional donors together, aid would have declined by more than 3% in these years, net of in-donor refugee costs.
Data calculated as of April 2017.