Topics
1. ODA as a dedicated resource for poverty reduction Go to this section
1.1 AidWatch Canada’s Proxy Indicator on Poverty-Focused ODA
1.2 Country ownership of ODA
1.3 Emphasizing donor security concerns in ODA allocations
2. Allocation of global ODA to country income groups Go to section
2.1 Aid to Least Developed and Low Income Countries
2.2 Aid to Lower Middle Income Countries
3. Trends in humanitarian assistance Go to section
4. Climate finance and aid Go to section
5. ODA directed to gender equality Go to section
6. Civil society as aid providers in global development cooperation Go to section
7. Aid and the private sector Go to this section
8. South-South aid providers Go to this section
9. Methodological Note for global trends in ODA Download Methodological Note
NOTE: The statistics and commentary below has been derived from Brian Tomlinson, Global Aid Trends, 2016, Financing Agenda 2030: Where are the Resources? in the Reality of Aid Network, 2016 Global Reality of Aid Report, October 2016. A more in-depth analysis of these trends can be found in this chapter for the Reality of Aid Report.
The global statistical profile for ODA has been updated in Brian Tomlinson, September, 2018. Trends in the Reality of Aid, 2018: Growing diversions of ODA and diminished resources for the SDGs. A chapter for the Reality of Aid Global Report, 2018, Changing Faces of Aid (forthcoming). This update is not yet reflected in the various sections below.
1. ODA as a dedicated resource for poverty reductrion
Despite global attention to the Millennium Development Goals (MDGs) since 2000, there was never been a measure to track ODA dedicated to the MDGs. Similar issues of measurement are present in assessing ODA’s contribution to the Sustainable Development Goals, adopted by the UN in September 2015. In particular, to what degree is ODA focusing on poverty reduction and “leaving no one behind” in the achievement of the SDGs by 2030?
Eight conditions that make ODA as a unique resource for the achievement of the SDGs, irrespective of its scale relative to other development resources (such as private foreign investment).ODA’s potential contribution should be determined, not by a comparison to other financial flows to developing countries, such as those from the private sector, but by its characteristics as a dedicated resource for development shaped by public policy choices. Clearly, these potential characteristics have not fully realized to date.
The SDGs commit to ending extreme poverty by 2030 and to reduce by half the proportion of those living in poverty according to national definitions [SDG One]. It seeks to “ensure that all men and women, in particularly the poor and the vulnerable, have equal rights to economic resources, as well as access to basic services, ownership and control over land and other forms of property, inheritance, natural resources, appropriate new technology and financial services, including microfinance.”[UN, A/RES/70/1, 15/35]
Advancing on all forms of poverty requires a comprehensive approach, including acknowledging the inter-relationship of all SDGs and their impact on people living in poverty. This approach is reflected inter alia in SDG 2 – ending hunger; SDG 3 – ensuring healthy lives; SDG 4 – inclusive and quality education for all; SDG 5 – gender equality and empowerment of women and girls; SDG 7 – ensuring the availability of water and sanitation for all; and SDG 10 – reduction in inequality within and among countries.
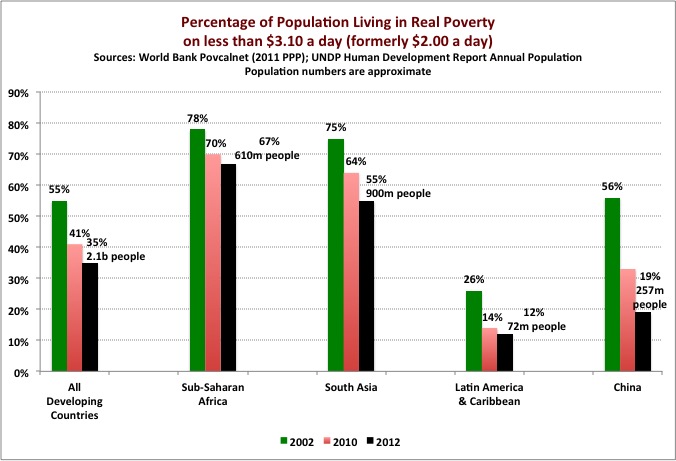
Levels of poverty: The levels of poverty have declined significantly in many parts of the South since 2000, particularly in China. Nevertheless, according to World Bank statistics, an estimated 15% of the population of developing countries (900 million people) still live in extreme poverty (defined by the World Bank as less than US$1.90 a day in income). These people are living in absolute destitution. In Sub-Saharan Africa this proportion in extreme poverty is 43%.
Another 20% of developing country populations are living on income between US$1.90 and US$3.10 a day. These people are also very poor, with income and assets barely able to cover the very basics in food and shelter, with little left over for health care and education for their children.
In total, 2.1 billion people live on less than US$3.10 a day or 35% of the population of developing countries. While achieving the SDGs requires the devotion of a diversity of financial resources, ODA is unique as a potential flexible, predictable and accountable resource that can be devoted reducing poverty and inequality. See a more extensive discussion of the scope of poverty in Brian Tomlinson, 2016, Global Aid Trends, 2016: Financing Agenda 2030, Where are the resources?
1.1 AidWatch Canada’s Proxy Indicator on Poverty-Focused ODA
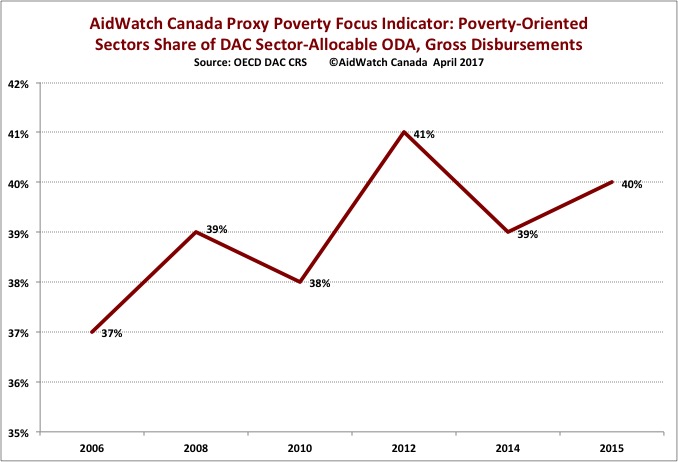
AidWatch Canada has developed a proxy indicator to reflect the degree of poverty focus based on DAC sector codes. See the poverty-oriented sectors here.
Considering all DAC donors’ sector-allocable ODA, the proxy indicator suggests that there has been only very modest improvement in the concentration on poverty-oriented sectors, growing from 37% of sector-allocable ODA in 2006 to 40% in 2015. The value (in 2010 US dollars) of these gross disbursements, however, has grown by 52%, from US$18.1 billion in 2006 to US$27.5 billion in 2015. During this period the value of ODA (Gross Disbursements) grew by 19% and total Sector-Allocable ODA by 43%.
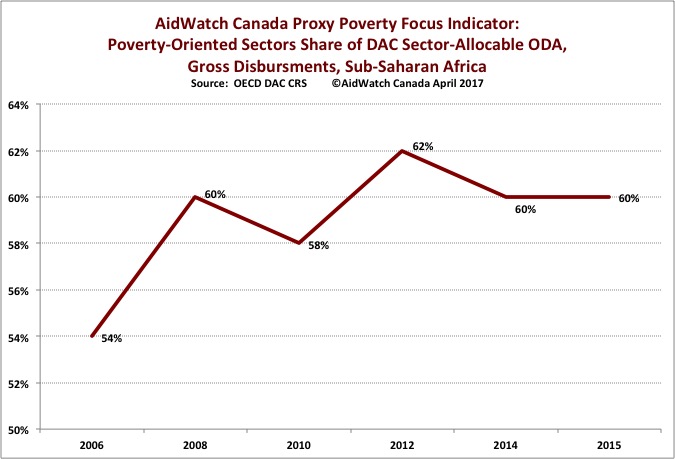
The experience of Sub-Saharan Africa has been different, with much greater concentration on poverty-oriented sectors and greater growth in the share of these sectors in sector-allocable ODA. The share of poverty-oriented sectors for this region grew from 54% in 2006 to 60% in 2015, with a major 93% increase in value from US$5.6 billion in 2006 to US$10.8 billion in 2010. During this period the value of ODA (Gross Disbursements) for Sub-Saharan Africa declined by 6.2% and total Sector-Allocable ODA grew by 71%.
All aid actors accept that strengthening country ownership through developing country governments and other development actors at the country level is essential for effective programs to address poverty. An important DAC measure in this regard is “country programmable aid” (CPA). CPA is the portion of DAC bilateral aid disbursements over which developing country partners have a significant say.
1.2 Country Ownership of ODA
“Country ownership” in the allocation of aid is the first principle of the 2005 Paris Declaration on Aid Effectiveness. While there are many issues in defining the meaning of country ownership — the process in determining legitimate country development plans, the inclusion of all development actors such as civil society and groups that are marginalized, the OECD DAC have developed a measure of the amount of ODA that is even available for country ownership. This measure in Country Programmable Aid.
In 2014, just over half of DAC donor gross bilateral aid (52.7%) is available to developing country partners to potentially program in ways that respond to their priorities and needs. Country Programmable Aid (CPA) has been declining slightly since 2010. The DAC’s CPA includes all forms of technical assistance, much of which continues to be driven by donor country priorities. If 80% of technical assistance is excluded from CPA, the proportion of aid available to developing countries to program drops to 48.6%, less than half of donors’ gross bilateral aid.
1.3 Emphasizing donor security concerns in ODA allocations
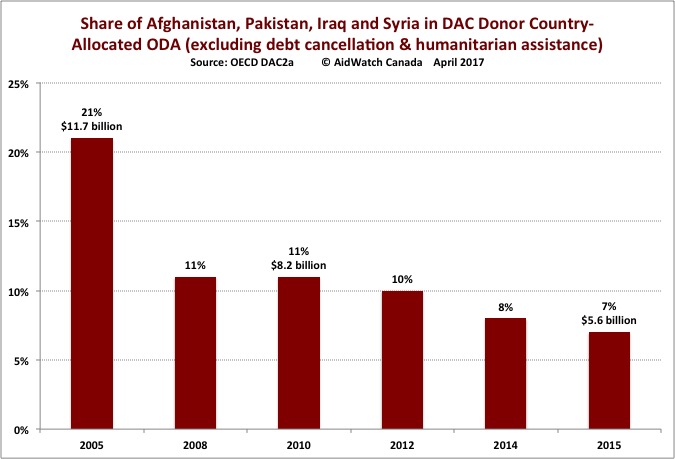
Foreign policy priorities relating to anti-terrorism continue has been driving country priorities over the past 10 years. Up to 2012, more than 10% of DAC country allocated aid has been channeled to four countries with strong security and military interest — Afghanistan, Pakistan, Iraq, and Syria (excluding humanitarian assistance and debt cancellation). These allocations severely limited a fair allocation to other low-income and lower middle-income countries for their poverty reduction goals. In more recent years (2014 and 2015) these four recipient countries have received approximately 7% of total country allocated DAC donor aid.
There has been growing attention to the use of ODA on activities to “prevent violent extremism.” Recent research points to the use of ODA for conflict prevention, peace and security, which has increased 67% since 2005. Of the US$3.1 billion allocated to these activities, security sector reform received significant ODA resources (US$700 million).
Data calculated as of April 2017.
2. Allocation of global ODA to country-income groups
2.1 Aid to Least Developed and Low Income Countries
At the 2015 Addis Ababa Financing for Development Conference all countries pledged to increase their aid to least developed countries, honouring a long-standing commitment of “0.15 to 0.20 per cent of ODA/GNI to least developed countries” [§51 of the Addis Ababa Action Agenda]. To date, very few countries has achieved this goal.
In 2015, DAC aid providers disbursed a mere 0.09% of their combined Gross National Income to Least Developed Countries [OECD DAC2a and OECD DAC1a Tables). Movement towards the minimum 0.15% goal for least developed countries will require significant progress in advancing the overall the UN 0.7% ODA/GNI goal (in 2015 at 0.30%).
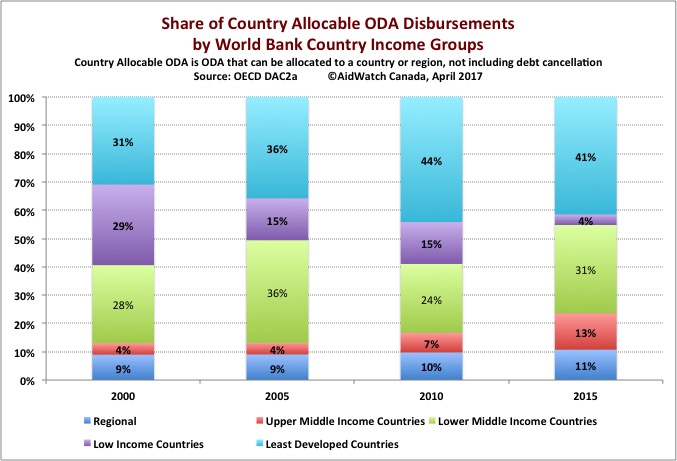
While this ODA/GNI goal for least developed countries remains important, aid has been equally important for a number of low income countries that have not bee included among the least developed. Aid to both least-developed (LDCs) and low-income countries (LICs) has declined since 2000 from 59% of total country-allocable aid in 2000 to 45% in 2015. Country-allocated ODA excludes refugees and student support in donor countries and debt cancellation.
Chart: Share of Country-Allocable ODA Disbursements by World Bank Country Income Groups (including regional disbursements and excluding debt cancellation)
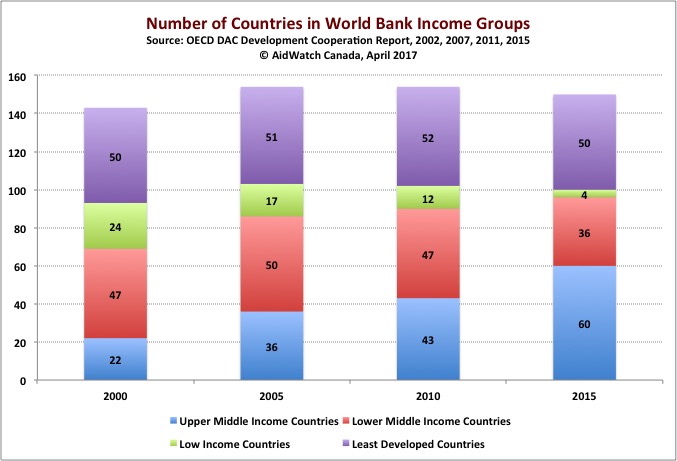
At the same time, the number of low income countries has declined sharply from 24 countries in 2000 to 4 countries in 2015. Most have graduated into the ranks of lower middle income countries, where people living in poverty continue to make up a significant share of the population (see below). The number of least developed countries has remained relatively constant at 50 countries.
While their share in total ODA disbursements to least developed and low income countries has declined, the value of these disbursements (in 2015 US dollars) has increased from US$30 billion in 2000, to US$53 billion in 2010, but declined to US$45 billion in 2015.
Since 2005, aid to Afghanistan has been a significant factor in this increase in the value of ODA to LDCs. Afghanistan made up 19% of LDC ODA in 2005, 24% in 2010, and still 16% in 2015. Other LDCs and LICs therefore have received correspondingly less aid resources than one might expect from the growth in value of these resources since 2000.
Taking into account the declining number of low income countries, the average share of ODA disbursements for each LDC or LIC more than doubled (in 2015 dollars) from US$400 million in 2000 to US$830 million in 2015. Aid providers have concentrated significantly more of their aid dollars in fewer least developed and low income countries.
2.2 Aid to Lower Middle Income Countries
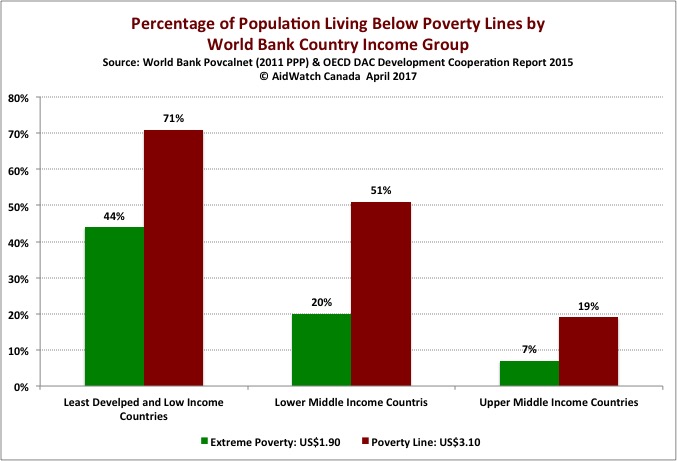
The overarching goal of ODA is to reduce poverty and inequality. It is therefore important to consider the countries where people living in poverty reside. As noted above in section one, poverty remains pervasive across developing countries, particularly when considering a poverty line of US$3.10 a day. This chart sets out the percentage of population living below US$1.90 a day (extreme poverty) and US$3.10 a day (poverty line).
Least developed and low income countries have 44% of their population living in extreme poverty, and more than 70% living below the poverty line. But lower middle income countries [LMICs] (many of which “graduated” from LDC/LIC status) still have 20% living in extreme poverty and more than 50% below the poverty line. While each LMIC varies, the influence of India is prominent in these number where 58% of the population live on less than US$3.10 a day.
Even Upper Middle Income Countries, where most would argue that aid is needed the least, has 7% of their population living in extreme poverty and just under 20% living below the poverty line. The latter is affected by the experience of China with27% of its population below US$3.10 a day, despite considerable progress in tackling extreme poverty.
Chart: Poverty Levels and Country Income Groups
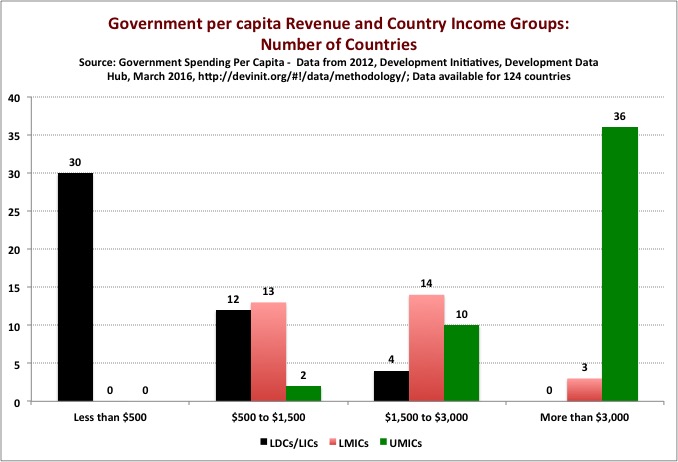
Consideration should also be given to the amount of government revenue (net of ODA receipts) available to dedicate to reducing poverty and achieving the SDGs. On average, the developed countries have per capita government revenue of more than US$15,000 available for all public expenditures, including poverty reduction. By contrast, 30 LDCs/LICs have less than $500 per capita and another 12 countries between US$500 and $1,500 per capita.
Among 27 lower middle income countries, the per capita government revenue is less than $3,000, with half of these countries making due with between US$500 and US$1,500. These numbers provide a strong rationale for focusing ODA not just on the least developed, but also lower middle income countries. Interestingly among 46 upper middle income countries, 10 have per capita government revenue of less than US$3,000.
Chart: Government per capita Revenue and Country Income Groups: Number of Countries
Taking into account ODA disbursements for lower middle income countries, 77% of country-allocable ODA goes to countries that include 85% of people living in extreme poverty (less than US$1.90 a day) and 79% of people living on the margins of extreme poverty (between US$1.90 and US$3.10 a day). [Author calculation from World Bank poverty statistics, accessed March 2016]
Share of aid to low income and lower middle income countries declining However, since 2010 there has been a worrying trend, with aid to low income and lower middle income countries declining by more than 7%. Aid has been shifting towards upper middle income countries, increasing from 7% in 2010 to 13% in 2015. Even more concerning, aid to least developed and low income counties has declined from 59% of country-allocable aid in 2010 to 45% in 2015. In part the increase in aid to upper middle income countries is due to high levels of humanitarian assistance to Turkey and Iraq. However, while less stark, the trends still stand when these countries are removed from the totals.
Data calculated as of April 2017.
3. Humanitarian assistance
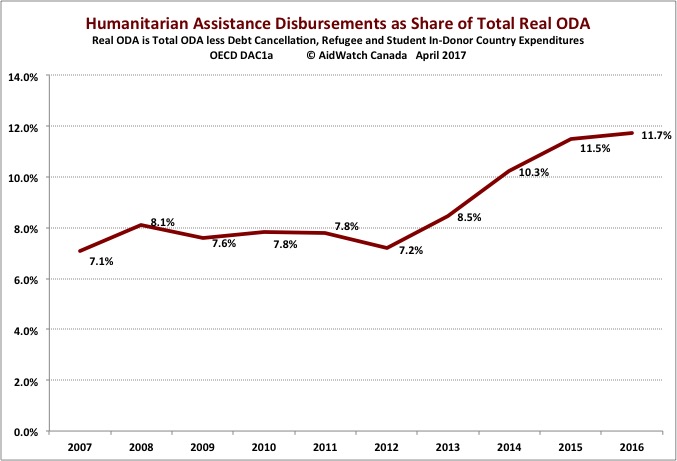
Humanitarian assistance from DAC donors has increased significantly as a percentage of Real ODA (ODA net of debt cancellation, students and refugees in donor countries) since 2012, rising from 7.2% to 11.7% in 2016. These recent increases are due to the growing and overwhelming humanitarian needs for refugees and displaced people in Syria, Lebanon and Iraq.
Chart: Humanitarian Assistance Disbursements as a share of total Real ODA
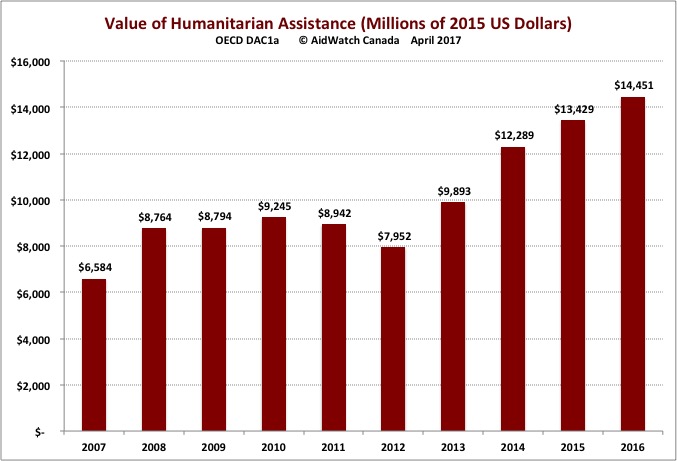
The value of humanitarian assistance has also increased dramatically since 2012, from US$7.9 billion to US$14.5 billion in 2016 (more than 80% in four years). In 2015 (the last year for country statistics) 28% of country allocated humanitarian assistance was directed to four countries in the Middle East (Iraq, Jordon, Lebanon and Syria). Turkey, a non-DAC aid provider, accounted for an additional US$2.7 billion in humanitarian aid to Syrian refugees in 2015. Sub-Saharan Africa remains a large recipient of humanitarian assistance at US$5.0 billion in 2015 (44% of total country-allocated humanitarian assistance).
Chart: Value of Humanitarian Assistance (2015 US Dollars)
Development Initiatives (UK) publishes an annual comprehensive report on humanitarian assistance tracking both private and public sources of finance for this purpose — The Global Humanitarian Assistance Report. The 2016 Report reported that humanitarian assistance from all sources, public and private, grew in 2015 for the third consecutive year to reach a record total of US$28 billion. But at the same time, the short-fall in fulfilling the UN coordinated appeals also grew to $US$8.9 billion, with different results for different appeals. Just 55% of the coordinated appeals were funded in 2015, the lowest level ever recorded.
The 2016 Report analyzes the sources of humanitarian finance, with just 20 donors providing 97% of the US$21.8 billion from governments. The United States accounts for almost one third of this amount. But Turkey was the second largest donor in 2015 at US$3.2 billion. Canada ranked ninth at US$873 million.
Private sources of finance (individuals, trusts, foundations and the private sector) are a growing source of funding for humanitarian assistance. In 2015, according to the Development Initiatives’ Report, these contributions reached US$6.2 billion, up from US$5.5 billion the previous year. These figures are likely an under-estimate as it is very difficult to include a variety of sources (faith-based organizations, domestic private sector, crowd funding, for example) at the domestic level. Contributions from the private sector increased significantly in 2014 (the last year for data) to US$1.8 billion.
For a detailed current analysis of issues and financing trends in humanitarian assistance see Development Initiative’s Global Humanitarian Assistance Report 2016.
The international community met in Istanbul at the first World Humanitarian Summit in May 2016. Among the many issues discussed, CSOs and other stakeholders call for particular attention to the issue of greater coordination, ramping up support for local resilience, less earmarked funding, financing for middle income countries hosting large numbers of refugees, and greater support for disaster risk reduction and preparedness (moving these allocations from 0.4% of ODA to 1% by 2020).
The Summit produced the “Grand Bargain” among major donors including several International NGOs, which set out 51 commitments in ten areas to improve the efficiency of delivery in the humanitarian aid system. Unfortunately no progress was made on increasing numbers of serious breaches of humanitarian law, including the bombing of hospitals, the targeting of civilians in conflict situations, and attacks on humanitarian workers. But on a positive note, the Summit also committed to increased access to humanitarian resources by local governments and local CSOs, with a goal of 25% of humanitarian funding to local and national responders by 2020.
Data calculated as of April 2017.
4. Climate finance and aid
The December 2015 Conference of the Parties (COP21) to the UN Framework Convention on Climate Change (UNFCCC), meeting in Paris, brokered an historic and far-reaching Paris Agreement with ambitious goals and measures for the mitigation and adaptation to climate change. Given this ambitious agenda, the Agreement recognized “the urgent need to enhance the provision of finance … in a predictable manner,” [Preamble] calling on developed countries to maximize the mobilization of resources from all sources in ways that “such mobilization of climate finance should represent a progression beyond previous efforts”. [Annex, Article 9] Developed countries agreed to continue their existing collective mobilization goal [USD 100 billion per year] through 2025. [Paragraph 59] This US$100 billion target was set in 2009 at Copenhagen Conference of Parties and is to be achieved no later than 2020.
Despite an ambitious agenda and financing targets, the Parties to the Convention have never agreed on several very critical issues that affect the credibility of these commitments:
- What constitutes climate finance and how to count climate finance towards the US$100 billion goal?
- What is the appropriate modality for climate finance — loans or grants. Should climate finance be counted on a net basis (less repayment of debt)? Should only concessional finance be counted? How should private sector climate finance be included and measured against impacts for mitigating and adapting to climate change?
- Will public donor climate finance be additional to ODA? In 2007 at Bali Parties to the Conference agreed to the principle of “additionality”. But since then most donors have included climate finance within their ODA. Should donors’ climate finance within ODA, where the donor has not achieved the ODA goal of 0.7%, be included in the commitment to achieve the US$100 billion target?
Without clear answers to these questions it is very difficult to hold the international community accountable to the financing commitments made in Paris in 2015.
The 2009 COP in Copenhagen not only established the US$100 billion target, but also launched the Fast Start Finance initiative in which donors committed to invest an immediate US$30 billion for climate finance. While developed countries honoured their Copenhagen commitment to invest US$30 billion in Fast Start Finance for climate change mitigation and adaptation, donor reporting of ODA made it impossible to determine if this financing was additional to ODA commitments. Donors have reported more than 80% of climate financing to the DAC as part of their ODA. Only 30% of this Fast Track Finance financing was for adaptation, affecting the impacts of climate change on poor and vulnerable populations.
How much progress has been made to date with respect to the US$100 billion target? In a comprehensive report, the OECD suggests that private and public finance by developed countries for “climate action” in developing countries reached US$62 billion in 2014, up from US$52 billion in 2013. According to this report 70% of these resources were public or mulitlateral flows and 25% were private sourced funds, usually mobilized through donor public finance activities. The remaining funding were export credits. The report also acknowledged that only one-sixth of this funding went to adaptation, despite the Paris Agreement commitment to achieve a balance between adaptation and mitigation in climate finance [Annex, Article 9]. Poor and vulnerable populations will be disproportionately affected by extreme climate events.
According to the DAC, in 2014 just five donors (Germany, Japan, France, the US and Norway) provided more than 79% of ODA that they marked as climate finance for mitigation. These same donors, with the substitution of Sweden for Norway, provided 67% of adaptation finance through ODA.
The Green Climate Fund, launched just prior to the Paris Conference, is mandated by the UNFCCC as the primary financial instrument for public climate finance. The Fund is now the largest climate facility with more than US$10.3 billion in pledges and US$2.9 billion in paid up funds. Canada has contributed to the Green Climate Fund US$155 million in a grant and US$102 million in loans (with a grant equivalent of US$20 million).
For an analysis of Fast Track Finance for climate change in the Canadian context see Brian Tomlinson, “An Assessment of Canada’s Commitments to Fast Start Climate Finance, 2010 to 2012.” Prepared for the Canadian CSO Climate Change and Development Coalition (C4D), October 2013.
The World Resources Institute tracks climate finance initiatives at the global level. The International Institute for Sustainable Development (IISD) also publishes a regular update on climate finance.
Data calculated as of April 2017.
5. ODA directed to gender equality
The OECD DAC uses a project policy marker to track donor disbursements for gender equality and women’s rights. Donors are asked to screen and score their projects according to three criteria: 1) gender equality is the principal objective of the project (gender equality is the stated primary goal); 2) gender equality is a significant objective (gender equality is one of several objectives of the activity); or 3) there are no gender equality objectives in the activity.
There are several questions related to the interpretation of this system, particularly with the “significant” marker. Donors tend to employ different interpretations of the meaning of a “significant” gender objective, a problem for inter-donor comparability. But also as a policy marker, donors count the full value of the activity when an activity is deemed “significant,” even though gender equality may only be one of several objectives. In both cases this can produce inaccurate results, ones that exaggerate the financial commitment to gender equality and women’s empowerment. See discussion in this document.
Support for gender equality as a principal objective in projects has increased in value, but remain a very small proportion of screened bilateral ODA.
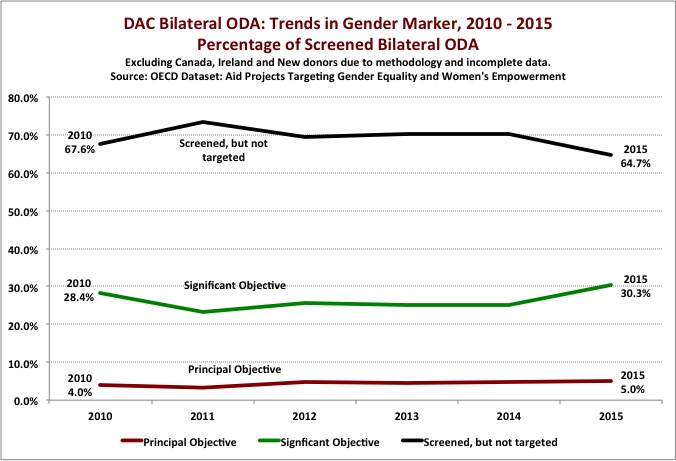
Chart: DAC Bilateral ODA: Trends in the Gender Marker, 2010 to 2015, Percentage of Screened Bilateral ODA.
Given the methodological limitations of the significant marker, the principal marker can serve as a proxy for the importance that donors give to gender equality in the allocation of their ODA. Between 2010 and 2015, according to the latest DAC report, allocations to projects where gender equality is a principal objective have increased very slightly as a share of screened bilateral ODA, from 4% in 2010 to 5% in 2015. The value of this ODA (in 2013 dollars) however increased from US$3.1 billion to US$5.7 billion, a significant increase of 84%, although from a very low base of US$3.1 billion. In 2015 an alarming 65% of donor screened ODA had no gender equality objectives!
Five donors account for 73% of bilateral ODA activities with a gender marker of principal objective – the United States (30% of the marker total), the UK (21%), the Netherlands (9%), Norway (7%), and Sweden (6%).
Another proxy for the importance donors give to gender equality is their support for women’s rights organizations. At 0.4% of all screened ODA in 2015, this support is almost invisible. Even as a share of aid marked gender equality principal objective, this support is a mere 8.2%. These are the organizations that will be the main drivers of the gender equality SDG.
This poor performance in the allocation of aid for purposes related to gender equality is in stark contrast to the rhetoric of donors on gender equality and women’s empowerment as an essential condition for making progress in the 2030 Agenda.
For an analysis of the gender equality marker in the Canadian context see Brian Tomlinson, Canada’s Aid Marker for Gender Equality, Aid Watch Canada Briefing Paper #4, November 2013
For an analysis of funding for women’s rights organizations, see the work of the Association for Women’s Rights in Development (AWID). See also the OECD DAC’s study of donor support for southern women’s rights organizations.
Data calculated as of April 2017.
6. Civil society as aid providers in global development cooperation
Civil Society Organizations (CSOs) provide significant resources for development. In developed countries, they are channels for individuals’ contributions and government aid funds, which they direct towards CSOs working on the ground at community level in developing countries. They contribute to innovative social sector projects, support humanitarian assistance, provide public education on development issues, and hold governments to account for their commitments and good governance.
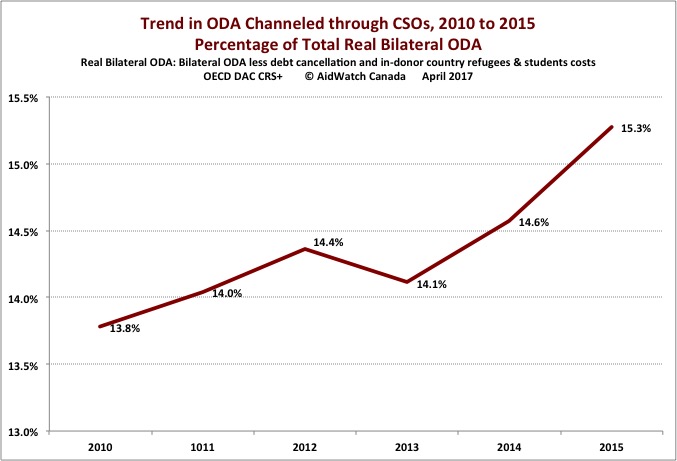
DAC donors channeled US$17.9 billion of their ODA through CSOs in 2015, down slightly from US$18.7 billion in 2014. ODA through CSOs was 15.3% of real bilateral ODA for 2015 (net of refugees in donor countries, imputed student costs, and bilateral debt cancellation), the highest level since 2010. Multilateral organizations channeled an additional US$2.6 billion, bringing the total for all donors to US$20.5 billion.
For several donors such as Ireland, Sweden, and the Netherlands, aid delivery through CSOs is more than 30% of their real bilateral aid in 2015. For Canada, according to DAC statistics, the proportion is 28% for that year.
Chart: Trend in ODA channeled through CSOs, 2010 to 2015, Percentage of Real Bilateral ODA
Table: Select donors aid through CSOs as a Percentage of Real Bilateral ODA
When these donor resources channeled through CSOs are combined with CSOs’ private donations, CSOs are managing approximately US$70 billion in development assistance annually, mainly from DAC countries. This amount is equal to about 70% of DAC donors’ Real ODA in 2015 (net of the amount transferred through CSOs). [AidWatch Canada estimation. There are significant methodological issues in estimating the total of these annual private resources for CSOs. See Tomlinson, Reality of Aid and the section on Civil Society as Aid Providers]
Financial flows from the largest International NGO families (INGOs) make up a significant and growing amount of aid from CSOs. Eight global INGOs had combined global revenue from all their affiliates of over US$11.7 billion in 2011, up more than 40% since 2005. These eight INGO families would make up almost a fifth (18%) of the estimated total CSO development assistance noted above. [AidWatch Canada calculation based on INGO annual reports.]
The call for inclusive partnerships to implement Agenda 2030 require not only the inclusion of CSO resources for development, but also addressing the deteriorating enabling environment for CSOs as development actors in many developing, and some developed, countries.
For current information on the legal, regulatory and inclusion issues for CSOs see also CIVICUS, the International Center for Not-for-Profit Law (ICNL), and FOAA Online.
For a detailed analysis of ODA financing of Canadian CSOs involved in development cooperation go to CSOs in development page.
Data calculated as of April 2017.
7. Aid and the private sector
Measurement of the extent of private sector contributions to development cooperation is also not captured in DAC databases, with the exception of public private partnerships (PPPs). According to DAC statistics, the value of ODA (in 2015 dollars) to PPPs peaked in 2010 at US$817 million, but since then the value of ODA for PPPs declined sharply to US$355 million in 2012, rising to US$639 million in 2015. Five donors — Belgium, Germany, the Netherlands, the UK and the US — account for more than 85% of these PPP disbursements in 2015. (DAC CRS Database). ODA for PPPs seems to be highly volatile.
Without similar comprehensive data, particularly on partnerships with the private sector at the country level, the reality and nature of private sector partnerships remain elusive. Much of the growing roles of the private sector in development cooperation are indirect via support for these roles through multilateral development banks and other development finance institutions (DFIs). The latter enable the private sector to collaborate and invest in development through public financed subsidies, investment guarantees and innovative risk mitigation products. See the work of Eurodad on DFIs.
Donors are now pro-actively engaging the corporate private sector, not only as economic actors, but also as development partners in their own right. This preoccupation is focused often on an open enabling environment for business, with the implication that dialogue with this sector assumes development roles by the private sector, which is seldom defined. Greater analytical distinctions between different private sector actors and inclusive dialogue on the normative foundation for the private sector’s contributions to development, should explicitly inform the private sectors’ roles in Agenda 2030 and SDGs.
The DAC donors are currently (April 2017) discussing changes to the rules governing inclusion of private sector instruments in ODA. Changes to these rules (taking account investment guarantees, untying provisions, loan concessionality, transparency) could significantly inflate future levels of ODA. CSO have been highly critical of many of the proposals for new aid rules. See here, here, and here.
Data calculated as of April 2017.
8. South-South aid providers
South-South aid-providers will be playing a crucial role in financing and knowledge exchange for Agenda 2030 and the achievement of the SDGs. According to the Addis Ababa Agenda for Action,
“South-South cooperation [SSC] is an important element of international cooperation for development as a complement, not a substitute, to North-South cooperation. We recognize its increased importance, different history and particularities, and stress that South-South cooperation should be seen as an expression of solidarity among peoples and countries of the South, based on their shared experiences and objectives. … We welcome the increased contributions of South-South cooperation to poverty eradication and sustainable development. We encourage developing countries to voluntarily step up their efforts to strengthen South-South cooperation….” [Addis Ababa Action Agenda, §56 & §57]
SSC aid flows increased to US$32.2 billion in 2014, but the increase since 2012 is highly concentrated among three donors – Saudi Arabia, Turkey and the UAE.
SSC has been growing significantly in scale over the past five years. By 2014/15 AidWatch Canada estimates that middle-income aid providers are contributing approximately US$32.4 billion to development cooperation, up from an estimate of US$12 billion in 2012. But the increases since 2012 have been highly concentrated among three donors — Saudi Arabia, the United Arab Emirates and Turkey. The primary focus for these donors, and the dramatic increases in SSC resources, is the ongoing crisis in the Middle East, particularly in Syria and Egypt.
Table: South-South Cooperation: Estimates of Concessional Flows for Development
SSC flows are now about 46% of DAC donors’ Country Programmable Aid (including humanitarian assistance) and about one-quarter of DAC real ODA in 2014.
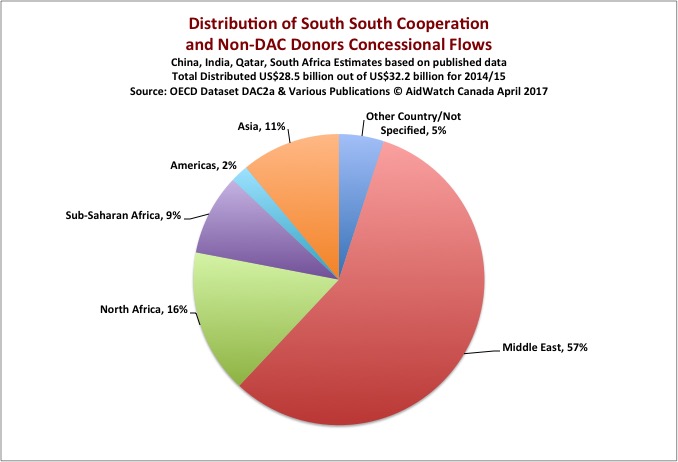
The Middle East accounted for almost 70% of SSC flows in 2014/15. China and India are the primary SSC aid providers beyond the Middle East, with approximately $5 billion in flows annually.
Chart: Regional distribution of South South Cooperation in 2014/15
The Chart above tracks the regional distribution of SSC and non-DAC donor flows. It is evident that the primary focus for 2014/15 flows is the Middle East and North Africa, which make up 73% of those flows distributed by region. Sub-Saharan Africa received only 9% of the recorded flows, most of which came from China and India. India is reported to allocate at least 80% of its concessional aid to its immediate neighbours, particularly Bhutan. While Arab aid providers are presently contributing much needed humanitarian support in the Middle East and North Africa, this is, hopefully, a time-specific urgency. So a high percentage of this aid may not be available for the 2030 Agenda, as it is likely to decline when the immediate humanitarian crises in the region subside.
Concessional South-South Cooperation forms only part of an emerging parallel development finance architecture.
South-South Cooperation represents a broad range of assistance efforts between middle-income SSC providers and other developing country partners. SSC financing extends beyond the scope of concessional development finance. In an increasingly multi-polar world, several rapidly developing middle-income countries, lead by China, are creating a parallel development finance architecture. These initiatives include the recently launched the BRICS New Development Bank, the Chinese-sponsored Asia Infrastructure Development Bank, and China’s South-South Cooperation Fund.
These Southern-initiated institutions create new and alternative opportunities for country governments seeking development finance. However, some concerns and cautions have been noted. For example, when the New Development Bank made its first loans in early 2016, civil society critics expressed concern about the absence of transparency and sufficient environmental and social safeguards in the Bank’s approval processes.
The role for China in future development cooperation in support of the SDGs is expanding.
At the end of 2015, China made a number of significant announcements regarding future initiatives for its development cooperation. At the Special Session of the UN for the SDGs in September, President Xi Jinping announced the creation of a US$2 billion fund to support South-South Cooperation. He committed to forgiving the debt owed China by relevant LDCs, landlocked developing countries, and small island developing countries.
At the second Summit of the Forum on China-Africa Cooperation (December 2015), China’s President announced US$60 billion in funding for Africa over the next three years. This included:
- US$5 billion in interest free loans;
- US$35 billion in preferential loans and export credit;
- US$5 billion in additional capital for each of the China-Africa Development Bank and Special Loans for the Development of African SMEs; and
- US$10 billion to support a fund for China-Africa production capacity development.
There was no indication of the degree to which these announcements would affect the level of concessional finance (ODA-like) in future years.
Data calculated as of April 2017.