Topics:
Trends in Canadian ODA Disbursement: Totals and Performance
(Updated January 2022)
1. Recent annual disbursements in Canadian ODA Go to this section
2. Calculating “Real Canadian ODA” Go to this section
3. Canadian ODA Performance Go to this section
4. A Ten Year Plan to Achieve the UN ODA target of 0.7% of Canada’s GNI Go to this section
5. Historical trends in Canadian ODA Performance Go to this section
6. Methodological Notes Go to this section Download as pdf
1. Recent annual disbursements in Canadian ODA
Recent Global Affairs Canada official Statistical Reports for Canadian Official Development Assistance (ODA) detail annual aid disbursements (current dollars):
2021/22: $7,600 million (AidWatch Canada preliminary estimate)
2020/21: $7,580 million (AidWatch Canada preliminary estimate)
2019/20: $5,889 million (Actual disbursements, Statistical Report)
2018/19: $6,164 million (Actual disbursements, Statistical Report)
2017/18: $5,702 million (Actual disbursements, Statistical Report)
2016/17: $5,293 million (Actual disbursements, Statistical Report)
2015/16: $5,254 million (Actual disbursements, Statistical Report)
2014/15: $5,684 million (Actual disbursements, Statistical Report)
2013/14: $4,836 million (Actual disbursements, Statistical Report)
2012/13: $5,324 million (Actual disbursements, Statistical Report)
2011/12: $5,511 million (Actual disbursements, Statistical Report)
2010/11: $5,571 million (Actual disbursements, Statistical Report)
Detailed disbursements by project for each fiscal year are available in the Historical Projects Data Set.
After implementing 8% annual increases to international assistance during the period, 2003 to 2010, Canadian ODA increased over the decade, reaching a high for the decade in 2010/11 with $5,571 million disbursed.
Sustained increases to Canadian ODA require annual compounding increases to the International Assistance Envelope (IAE), similar to the 8% annual increases to aid in the 2000s. Federal Budget 2018 added $100 million to the IAE annually up to 2022/23. Federal Budget 2019 extended this increase to 2023/24. There has been no Federal Budget for 2020/21.
In 2019/20, the last year that official statistics are available, actual Canadian ODA increased to $5,889 million over 2010/11 or by only 5.7%. But all of this increase is accounted for by significantly increased in-donor refugees costs, growing from $323 million in 2010/11 to $846 million in 2019/20. Without in-donor refugee costs, aid in 2019/20 is 3.9% lower than 2010/11.
AidWatch Canada estimates ODA for 2020/21 will be approximately $7,580 million, which includes more than $1.0 billion estimated additional aid during the year for Canada’s response to the COVID-19 pandemic. As noted above there was no Federal Budget for 2020/21.
The April 2021 Budget and December 2021 Economic and Fiscal Update outlined approximately $1.5 to $1.7 billion in additional commitments for fiscal year 2021/22 (depending on a range of new resources for climate finance for that year). The estimate for Canadian ODA for 2021/22 is approximately $7.6 billion. This estimate includes announced $375 million in additional expenditures directly related to the COVID-19 pandemic, but do not include an estimate for Canadian in-kind aid for donated vaccines for this year (which is yet to be agreed by the OECD DAC as ODA).
The 2021 Fiscal Update also committed to increases in the base amount for the International Assistance Envelope after 2023/24, but did not specify an annual amount of increase.
See Table One: Canadian ODA, Real ODA and Canadian ODA/GNI Performance, 2010 to 2020. Real ODA is Actual ODA less in-donor refugee and student costs, debt cancellation and interest paid on ODA loans.
For long term trends in Canadian ODA, see Historical Trends for Canadian ODA, 1980 – 2019 below.
What is Official Development Assistance? — See a definition by the OECD Development Assistance Committee.
Data calculated and posted, January 2022.
2. Calculating “Real Canadian ODA”
Official Development Assistance is a statistical construct that is based on a definition of concessional resource transfers from aid providing countries to aid recipient countries. This definition has been agreed by consensus by members of the OECD’s Development Assistance Committee (DAC).
As a “provider perspective”, ODA is an accountability measure for DAC donors. Aid can also be calculated from a “recipient perspective”. The main difference is how aid channeled through multilateral organizations is treated. The provider perspective counts all DAC aid as it is recieved by the multilateral organization. A recipient perspective counts only aid received by a partner country in a given year from these organizations.
Donors meeting in the OECD’s Development Assistance Committee (DAC) have established the rules for the calculation of ODA, which they have amended periodically over the past 40 years. Detailed rules for reporting ODA are available from the DAC. According to these rules, providers like Canada are permitted to include in their annual ODA an estimate of expenditures for refugees for their first year in the provider country, an estimate of the costs associated with students studying in the provider country who come from a developing country, and the full value of any debt that is cancelled by the provider country in the year that it is cancelled.
While these three areas are all highly desirable expenditures on the part of provider governments, they do not amount to any transfer of funds to developing countries. Debt cancellation is beneficial, but its value to a developing country government is often spread out over several decades. Therefore, amounts dedicated to these purposes can significantly distort the value of ODA in a given year.
Many CSOs discount these three items (as well as interest received on ODA loans) from a provider’s ODA to have a more accurate value for aid that is available to developing countries (or what CSOs call “Real Aid”). The DAC CSO Reference Group, an open platform of CSOs, lobbies the DAC on reforms the notion of ODA, including removing these items from its official calculations of ODA.
While the DAC has not yet had agreement from the providers to make this reform, the DAC itself recognizes these distortions. It publishes an annual estimate of “Country Programmable Aid” for each provider’s bilateral aid on its web site.
Like many providers, Canada opts to include these three items in its calculation of Canadian ODA. Their inclusion inflates the size of Canadian ODA, but unlike some European providers, the government does not budget for refugees in Canada out of the International Assistance Envelope (IAE), which is the main budgetary source for Canadian ODA. While these in-donor country expenditures are counted in Canadian ODA, they inflate the value of Canadian aid, but do not use IAE resources that otherwise would go to Canada’s development partners.
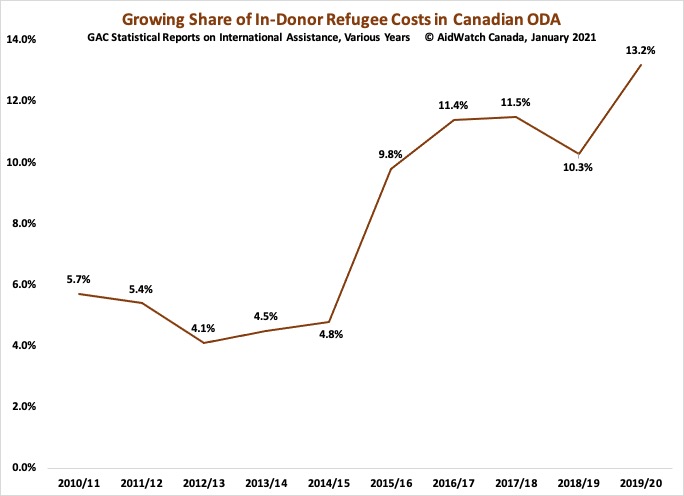
The share of in-donor refugee costs in Canadian ODA has grown over this past decade, particularly with the reception of Syrian refugees in Canada since 2015. This share has more than doubled over the past decade, from 5.7% in 2010/11 to 14.4% in 2019/20.
This Chart demonstrates the long term historical trends in Real ODA (converted to the value to 2018 dollars using the annual Consumer Price Index). Long term trends highlight the poor performance of Canadian ODA over these decades, particularly since the late 1980s. In 2019/20 Real ODA of $5.0 billion is actually lower than the value of Real ODA in 1988/89 of $5.5 billion. From its value in 2010/11, Real ODA in 2019/20 has declined by 12.2%. Due to significant new resources for Canada’s international response to COVID-19, Real ODA in 2020/21 is expected to increase significantly. It is estimated to be $6.7 billion in that year.
See also the Table, Historical Trends for Real Canadian ODA, 1980 – 2020, below.
Data calculated and posted, January 2022.
3. Canadian ODA Performance
In 1971, the United Nations adopted a financial goal for ODA, which is 0.7% of the donor country’s Gross National Income (GNI). Currently only five countries out of the 22 traditional DAC providers have achieved this goal – Sweden, Norway, Luxembourg, the United Kingdom and Denmark. The Netherlands historically has been a 0.7% country, but in 2013 it slipped below the target due to severe and continuing budget cuts.
Canada’s performance (Canadian fiscal year basis) has never exceeded 0.49% (1988/89). In more recent years, the high has been 0.34% of its GNI in 2009/10 and 2010/11. Since 2010, Canada’s performance, particularly for Real ODA (see above), has declined from this recent high:
-
- 2010/11: ODA: 0.34% Real ODA: 0.31%
-
- 2011/12: ODA: 0.31% Real ODA: 0.28%
-
- 2012/13: ODA: 0.29% Real ODA: 0.26%
-
- 2013/14: ODA: 0.26% Real ODA: 0.24%
-
- 2014/15: ODA: 0.29% Real ODA: 0.27%
- 2014/15: ODA: 0.29% Real ODA: 0.27%
-
- 2015/16: ODA: 0.26% Real ODA: 0.23%
- 2015/16: ODA: 0.26% Real ODA: 0.23%
-
- 2016/17: ODA: 0.29% Real ODA: 0.26%
- 2016/17: ODA: 0.29% Real ODA: 0.26%
-
- 2017/18: ODA: 0.27% Real ODA: 0.23%
- 2018/19: ODA: 0.28% Real ODA: 0.25%
- 2019/20: ODA: 0.26% Real ODA: 0.22%
- 2020/21: ODA: 0.34% Real ODA: 0.30% (AidWatch Canada Estimate)
- 2017/18: ODA: 0.27% Real ODA: 0.23%
When measured against other donors at the DAC in 2020 (on calendar year basis for comparison with other providers), with a performance ratio of 0.31% of its GNI, Canada’s improved its ranking to 12th position (tied with Japan and Ireland) among 22 traditional DAC providers (a number of new countries such as Iceland have joined the DAC in recent years and are not included). In 2019, Canada ranked 15th (at 0.27%), tied with Austria.
The DAC (mathematical) average performance for these 22 providers in 2020 was 0.48% and 0.44% in 2019.
See also Historical Trends for Canadian aid performance, 1980 – 2020, below.
Data calculated and posted, January 2022.
4. A Ten Year Plan to Achieve the UN ODA target of 0.7% of Canada’s GNI
Given the current low performance of Canada’s ODA, it will take political will to invest consistently over the next ten years to increase the International Assistance Envelope (IAE) to achieve the UN target on 0.7% by 2030/31, contributing Canada’s fair share to a robust financing framework for Agenda 2030.
The International Assistance Envelope (IAE) is the main budgetary envelope from which ODA disbursements are drawn. As noted above, ODA also includes a number of non-budgetary items and these are included in these ten-year projections. AidWatch Canada have estimated the annual targets for increasing the IAE to achieve this target of 0.7% of Gross National Income (GNI). Assumptions are made regarding these non-budgetary items (refugees cost in Canada and imputed student costs in Canada) and the level of non-ODA finance within the International Assistance Envelope, as well as the grow of Canada’s GNI.
On average the IAE will need to grow after 2021/22 by 17% annually up to 2030/31. With this budgetary investment, it is possible to achieve 0.40% by 2025/26. ODA in 2024/25 would be $11.5 billion, up from an estimated $7.6 billion in 2020/21.
Data calculated and posted, January 2022.
5. Historical Trends in Canadian ODA Performance
Tables and Charts:
Trends for the 40-year period 1980/81 to 2019/20 are demonstrated in the table and charts below. Click on the link to bring up the table or chart.
1. This table, Canada’s Official Development Assistance: 1980 to 2021, provides annual data for Canadian ODA in current dollars and its value in 2020 dollars, Canadian Real ODA in current dollars and its value in 2020 dollars (see the definition of Real ODA above), the annual Canadian ODA and Real ODA performance ratio (ODA to Gross National Income). These amounts are for the Canadian fiscal year — April to March (and do not correspond to figures reported by the OECD Development Assistance Committee, which are in US dollars and based on a calendar year).
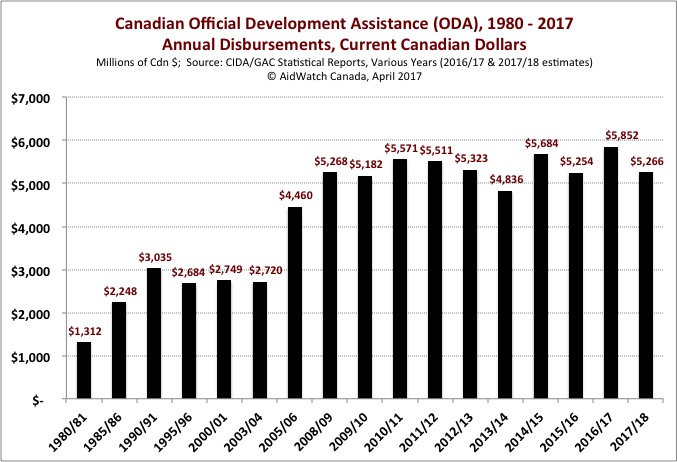
2. This chart, Canadian Official Development Assistance: 1980 to 2017, provides a representation of Canadian ODA in current Canadian dollars.
Canadian ODA declined from its peak in 2010 to 2013, but since 2014 has recovered, exceeding the 2010 level in 2016/17, mainly due to high levels of support for Syrian refugees in Canada in that year. In 2017/18 nominal Canadian ODA is expected to be below the level reached in 2010.
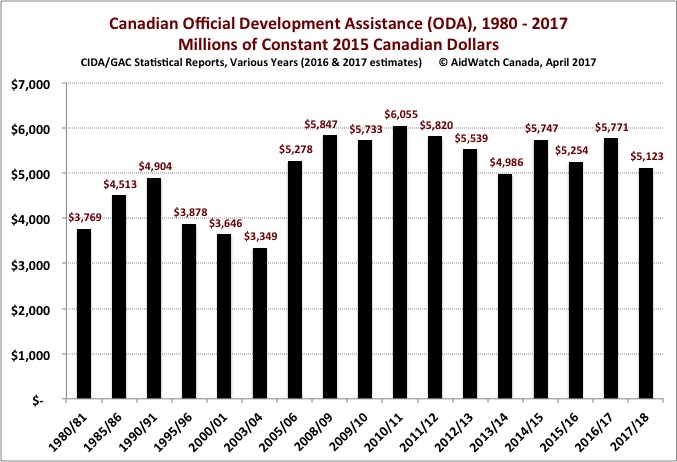
3. This chart, Canadian Official Development Assistance in 2015 dollars: 1980 to 2017, provides a representation of Canadian ODA in constant 2015 Canadian dollars.
This chart measures the value of Canadian ODA in 2015 Canadian dollars (removing the impact of inflation on the annual amount of disbursements). The trend between 2010 and 2017, despite annual variations (due to humanitarian assistance) is down. In the ten year period between 2005 and 2017 (the last year in which official statistics are available), the value of Canadian ODA has not increased at all. In 2016 and 2017 there may be some growth over 2005, but main due to Syrian refugee in-Canada expenditures included in ODA. In 1990, the value of Canadian ODA at $4,900 million (in 2015 dollars) was only $220 million less than AidWatch Canada’s current (April 2017) estimate for 2017.
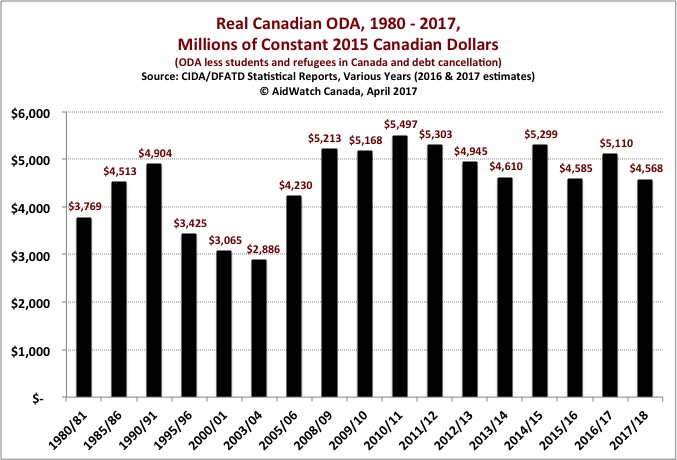
4. This chart, Canadian Real Official Development Assistance, 1980 to 2016, provides a representation of Real Canadian ODA in current Canadian dollars.
Real Canadian ODA is the measure of ODA less disbursements included in ODA for refugees for their first year in Canada, imputed costs for students studying in Canada, and debt forgiveness. It gives a more accurate picture of Canadian ODA resources that are available to developing country governments to program.
Real ODA reached its highest level in 2014 at $5,240 million. However, in the twelve year period since 2005, Real ODA has not increased — $4,860 million in 2005 and an estimated $4,710 million in 2017. See the discussion of Real ODA above.
5. This chart, Canadian Real Official Development Assistance in 2010 dollars: 1980 to 2017.
In real terms, the value of Real ODA in 2010 at $5,497 was the peak year. In 2015/16 (the last year that official statistics are available) the value of Real Canadian ODA ($4,585 million) fell by more than $900 million since 2010! While significantly higher in 2016/17 at an estimated $5,110 million, estimates for 2017 put the value of Real Canadian ODA at $4,568 million, similar to 2015/16. The actual value for 2017 may be affected by supplementary estimates adding to the International Assistance Envelope during the 2017/18 fiscal year.
Interestingly, the value of Real ODA in 1990 at $4,900 million was more than its value in 2015/16 ($4,585 million). Canada did not begin to include Canadian expenditures on refugees for their first year in Canada in its ODA until 1993.
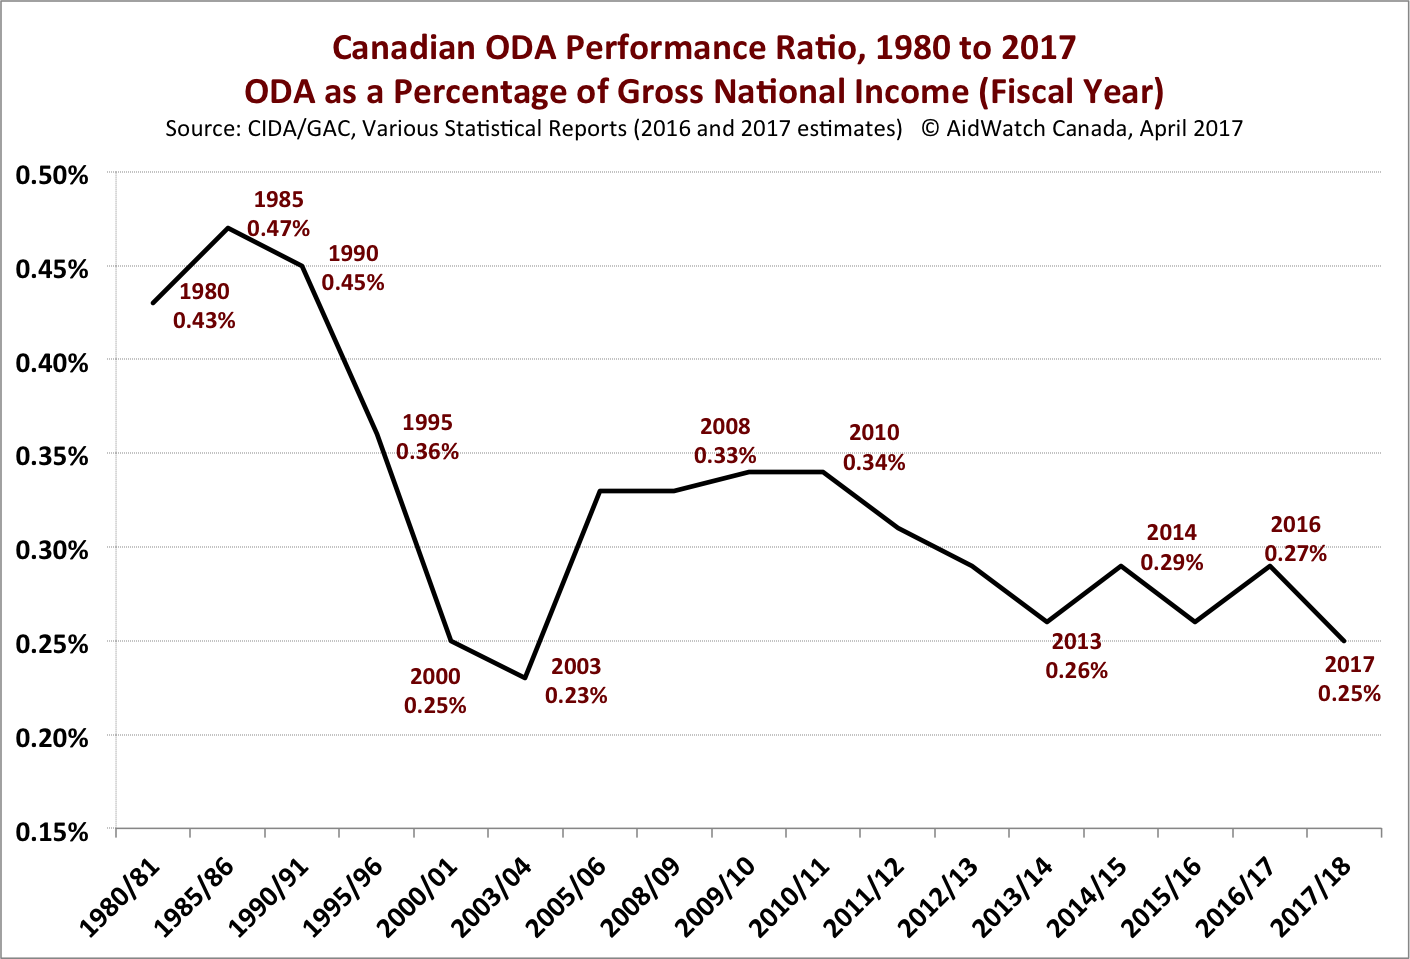
6. This chart, Canadian ODA Performance: 1980 to 2016 (fiscal year basis) provides a representation of Canadian ODA performance ratio (ODA to Gross National Income.
Canadian ODA performance, as measured by the percentage of Canada’s Gross National Income, has fallen dramatically since the early years of the 1980s and early 1990s. In 1988, this ratio was 0.49%, compared to 0.34% in 2010, 0.26% in 2015 (the last year that official statistics for ODA are available, and an estimated 0.25% in 2017. See the discussion of Canadian ODA performance above.
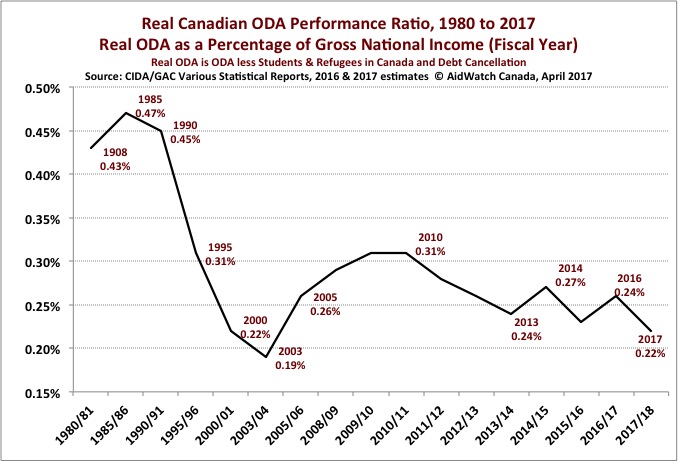
7. This chart, Real ODA Performance: 1980 to 2016 (fiscal year basis) provides a representation of performance for Real Canadian ODA (see the definition above).
The decline in Canadian ODA performance is even more dramatic for Real ODA as a percentage of Canadian GNI. From 0.49% in 1988 (when Canada did not include refugee and imputed student costs in its ODA), it reached a low of 0.19% in 2003, rising to 0.31% in 2010 (the peak year since 2000 for Canadian Real ODA disbursements), 0.23% in 2015 (the last year for which official ODA statistics are available), and an estimated low of 0.22% in 2017.
Canada’s generosity as a nation has not kept pace with the growth of its economy and the potential to finance ODA at considerably higher levels, maintaining levels achieved in the 1980s and early 1990s. AidWatch Canada has provided a ten-year timetable to rebuild Canadian ODA, reaching 0.7% by 2027/28 (see above).
Data calculated and posted, April 2017.
6. Methodological Notes
Please refer to the Methodological Notes for the sources and basis for calculating Canadian ODA on this page.